Multiple Choice
This OC curve represents a sampling plan developed for a lot size of 500,a sample size of 15,and an acceptance number of 2.The probability of acceptance for each of the first six points appears next to the plotted point.What is the average outgoing quality limit? 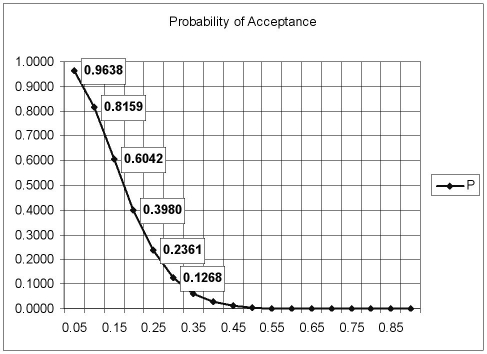
A) Less than 0.08.
B) Greater than or equal to 0.08 but less than 0.09.
C) Greater than or equal to 0.09 but less than 0.10.
D) Greater than or equal to 0.10.
Correct Answer:

Verified
Correct Answer:
Verified
Q9: Use Table I.1 for the following question.What
Q11: This OC curve represents a sampling plan
Q20: Increasing c while holding n constant decreases
Q31: A sample of 100 items is randomly
Q32: The maximum value of the average outgoing
Q42: A rectified inspection plan requires that:<br>A) a
Q43: A small _ can be disregarded in
Q56: Lot tolerance proportion defective (LTPD)can be defined
Q63: A manufacturer wants a sampling plan in
Q69: Discuss the two incorrect conclusions that can