Multiple Choice
Table 6.1
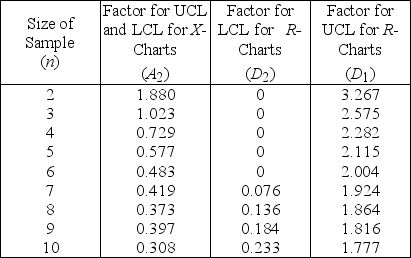
Factors for Calculating Three-Sigma Limits for the  -chart and R-chart
 Source: 1950 Manual on Quality Control of Materials,copyright
American Society for Testing Materials.Reprinted with permission.
-A milling operation has historically produced an average thickness of 0.005 inch with an average range of 0.015 inch.Currently,the first three items from each batch of 20 are inspected.Use Table 6.1.What is the value of the LCL  ?
?
A) less than or equal to 0.00100
B) greater than 0.00100 but less than or equal to 0.00299
C) greater than 0.00299 but less than or equal to 0.00499
D) greater than 0.00499
Correct Answer:

Verified
Correct Answer:
Verified
Q18: Samples of 100 checks each were taken
Q20: Which one of the following statements about
Q40: Which one of the following techniques will
Q48: is an approach to teamwork that moves
Q69: The implementation of a total quality management
Q73: Continuous improvement is a philosophy that<br>A) utilizes
Q90: _ means that customers expect the product
Q153: The upper limit and lower specifications for
Q168: Common causes of variation are the purely
Q220: The concept of quality at the source