Multiple Choice
Table 6.1
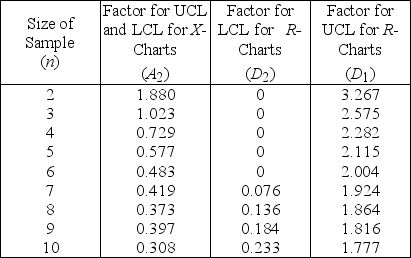
Factors for Calculating Three-Sigma Limits for the  -chart and R-chart
 Source: 1950 Manual on Quality Control of Materials,copyright
American Society for Testing Materials.Reprinted with permission.
-A milling operation has historically produced an average thickness of 0.005 inch with an average range of 0.0015 inch.Currently,the first three items from each batch of 20 are inspected.Use Table 6.1.The quality control manager has recommended inspecting the first 3 and the last 3 items.(a sample of 6) from each batch of 20.What is the value of the UCL  ?
?
A) less than or equal to 0.0030
B) greater than 0.0030 but less than or equal to 0.0049
C) greater than 0.0049 but less than or equal to 0.0069
D) greater than 0.0069
Correct Answer:

Verified
Correct Answer:
Verified
Q5: The philosophy behind problem- solving teams is
Q11: One way to achieve employee involvement is
Q24: A new product has been designed with
Q55: What are the key factors for controlling
Q109: Internal failure costs result from defects that
Q143: In applying quality control charts, assignable causes
Q169: <img src="https://d2lvgg3v3hfg70.cloudfront.net/TB5514/.jpg" alt=" is always equal
Q173: Whose philosophy of quality management focused on
Q174: Purely random, unidentifiable sources of variation that
Q209: One part of the sampling plan specifies