Multiple Choice
Table 6.1
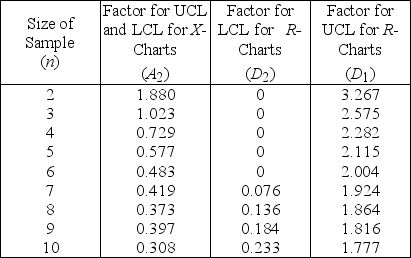
Factors for Calculating Three-Sigma Limits for the  -chart and R-chart
 Source: 1950 Manual on Quality Control of Materials,copyright
American Society for Testing Materials.Reprinted with permission.
-A milling operation has historically produced an average thickness of 0.005 inch with an average range of 0.0015 inch.Currently,the first three items from each batch of 20 are inspected.Use Table 6.1.What is the value of LCL  if the sample size is increased to 6?
A) less than or equal to 0.0030
B) greater than 0.0030 but less than or equal to 0.0049
C) greater than 0.0049 but less than or equal to 0.0069
D) greater than 0.0069
Correct Answer:

Verified
Correct Answer:
Verified
Q3: Which one of the following is a
Q11: Four samples of 100 each were taken
Q95: _ is a means of translating customer
Q102: Improving quality seems to be a strategic
Q116: Which one of the following is NOT
Q125: Self- managed teams essentially change the way
Q130: Which alternative will increase the probability of
Q162: Which one of the following statements about
Q164: _ costs are associated with preventing defects
Q168: Consumers consider various aspects when defining quality