Multiple Choice
Refer to the information provided in Figure 12.2 below to answer the questions that follow.
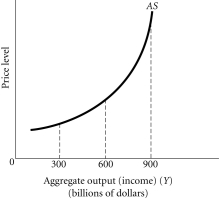 Figure 12.2
-Refer to Figure 12.2.Between the output levels of $300 billion and $600 billion,the relationship between the price level and output is
A) negative.
B) positive.
C) constant.
D) There is no relationship between the price level and output.
Correct Answer:

Verified
Correct Answer:
Verified
Q9: If government spending increases, then the IS
Q44: The Federal Reserve's policy to "lean against
Q83: If the combination r = 5% and
Q91: When the aggregate supply curve is vertical,which
Q95: The aggregate demand curve slopes downward because
Q96: A decrease in taxes on business investments
Q97: Related to the Economics in Practice on
Q112: _ shifts the IS curve to the
Q164: If there is a decrease in the
Q217: The level of aggregate output that can