Multiple Choice
Figure 8-5 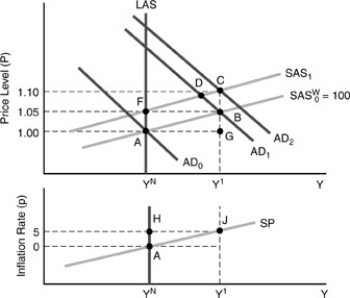
-In the figure above, the wage rate attached to SAS1 is
A) 1.10.
B) between 1.05 and 1.10.
C) 1.05.
D) 1.00.
Correct Answer:

Verified
Correct Answer:
Verified
Related Questions
Q30: If there is a permanent adverse supply
Q82: Given an adverse supply shock,a "neutral policy"
Q89: Can monetary policy maintain a constant price
Q102: In 1996,the growth rate of real GDP
Q106: At every current AD/SAS equilibrium point to
Q131: Which of the following was not a
Q153: Everywhere to the right of the long-run
Q161: Suppose that a country's workers are universally
Q166: If expectations are adaptive it means that
Q175: Oil price increases generally produce _ supply