Multiple Choice
Figure 8-5 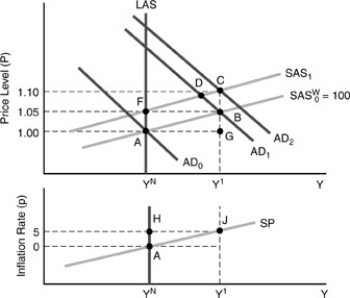
-In the figure above, in going from points A to B the real wage ________, and then from point B to point C (where the exact price level is 1.1025, rounded to 1.10 in the diagram) the real wage ________.
A) rose, remained constant
B) rose, rose again
C) fell, remained constant
D) fell, fell again
E) remained constant, remained constant
Correct Answer:

Verified
Correct Answer:
Verified
Q18: The short-run Phillips Curve gives<br>A)the actual short-run
Q65: The success or failure of economic policy
Q77: Figure 8-5 <img src="https://d2lvgg3v3hfg70.cloudfront.net/TB2857/.jpg" alt="Figure 8-5
Q83: Figure 8-2 <img src="https://d2lvgg3v3hfg70.cloudfront.net/TB2857/.jpg" alt="Figure 8-2
Q101: The recession of the early 1990s produced
Q105: An accommodating policy response to a supply
Q114: According to "Okun's Law," if expansionary monetary
Q141: The "indirect effect" of a beneficial supply
Q169: As the output ratio falls below 100%,unemployment<br>A)falls
Q177: In the SP/LP model it is possible