Multiple Choice
Figure 8-6 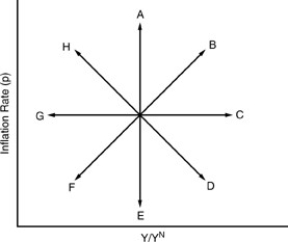
-In the figure above, the one year since 1970 that the U.S. economy managed to travel along path E was
A) 1971.
B) 1970.
C) 1979.
D) 1986.
Correct Answer:

Verified
Correct Answer:
Verified
Related Questions
Q14: Suppose than successive AD/SAS equilibrium points run
Q26: As the output rises above 100%,unemployment<br>A)falls and
Q58: Preeminent among the causes of supply inflation
Q125: "Overshooting" refers to a temporary period in
Q132: The segment of an adjustment loop in
Q133: In _ there were beneficial supply shocks
Q140: Given an adverse supply shock,an "accommodating policy"
Q158: If there is a supply shock and
Q173: A negative relationship between inflation and unemployment
Q174: From an initial long-run equilibrium with zero