Multiple Choice
Figure 7-1 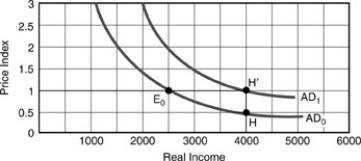
-Employing Figure above, assume that the initial equilibrium Y was 2500 at E0 prior to a change in the nominal money supply. The movement from E0 to  represents
A) an increase in the nominal money supply with a constant interest rate.
B) an increase in the nominal money supply with a constant price level.
C) a decrease in the nominal money supply with a constant price level.
D) a decrease in the nominal money supply with a rising interest rate.
Correct Answer:

Verified
Correct Answer:
Verified
Q6: If the marginal leakage rate is small,then
Q11: With the nominal wage rate given,an increase
Q27: At every point to the right of
Q35: In the figure above, from initial point
Q39: In the figure above, at point C,
Q41: Which of the following will NOT shift
Q55: Suppose we are at the natural real
Q111: Keynes argued that monetary policy would be
Q150: The most accurate capsule summary of the
Q151: Consider an initial IS-LM equilibrium point which