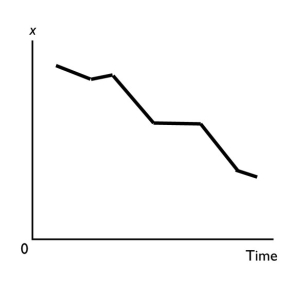
Multiple Choice

-A graph that shows the value of an economic variable for different groups in a population at a given time is called a
A) scatter diagram.
B) time-series graph.
C) pie chart.
D) cross-section graph.
E) fixed-time diagram.
Correct Answer:

Verified
Correct Answer:
Verified
Q187: As a shoe factory adds more workers,shoe
Q188: Proponents of cuts in income tax rates
Q189: Normative statements<br>i.describe how the world is.<br>ii.describe how
Q190: <img src="https://d2lvgg3v3hfg70.cloudfront.net/TB1458/.jpg" alt=" -The slope of
Q191: Gregory is considering attending a concert with
Q193: What is an opportunity cost? Give an
Q194: Of the three major economic questions,which of
Q195: If a small change in the x
Q196: If x increases and as a result
Q197: A linear relationship<br>A) when graphed is a