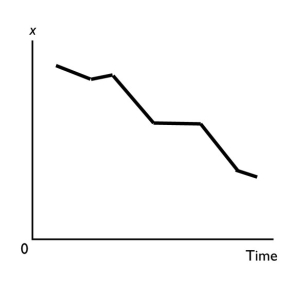
Multiple Choice

-A graph showing the values of an economic variable for different groups in a population at a point in time is called a
A) cross-section graph.
B) time-series graph.
C) scatter diagram.
D) Venn diagram.
E) None of the above answers is correct.
Correct Answer:

Verified
Correct Answer:
Verified
Q3: <img src="https://d2lvgg3v3hfg70.cloudfront.net/TB8586/.jpg" alt=" -What does the
Q14: Which of the following is a macroeconomic
Q15: Congress and the President passed a national
Q16: <img src="https://d2lvgg3v3hfg70.cloudfront.net/TB1458/.jpg" alt=" -In the diagram
Q17: Self-interest<br>A) reflects choices that are best for
Q18: If there is no scarcity,<br>A) the opportunity
Q20: Choices that are best for the individuals
Q21: <img src="https://d2lvgg3v3hfg70.cloudfront.net/TB1458/.jpg" alt=" -In the figure
Q22: The characteristic from which all economic problems
Q24: Rational choice<br>A) is a choice that uses