Multiple Choice
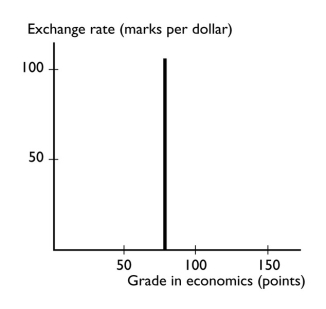
-The graph shows
A) a positive relationship that becomes less steep.
B) a negative relationship that is linear.
C) a positive relationship that is linear.
D) no relationship between the variables.
E) a trend relationship between the variables.
Correct Answer:

Verified
Correct Answer:
Verified
Related Questions
Q333: Which of the following is NOT a
Q334: In order to make a rational choice,people
Q335: You have chosen to take a trip
Q336: <img src="https://d2lvgg3v3hfg70.cloudfront.net/TB1458/.jpg" alt=" -The graph shows
Q337: The question of "What goods and services
Q339: A graph shows the wage rate of
Q340: If the change in y = -4
Q341: An economist observed that as more computers
Q342: A time-series graph measures<br>A) the value of
Q343: Wichita is building a convention center and