Multiple Choice
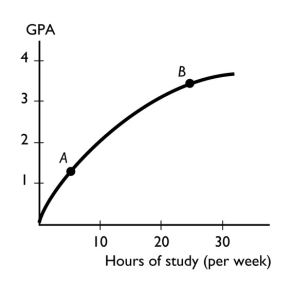
-The figure above shows the relationship between the time a student spends studying and the student's GPA that semester.This figure shows ________ relationship between the time spent studying and the GPA.
A) a positive but not linear
B) a negative
C) no
D) a positive, linear
E) cross-sectionally trended
Correct Answer:

Verified
Correct Answer:
Verified
Q3: <img src="https://d2lvgg3v3hfg70.cloudfront.net/TB8586/.jpg" alt=" -What does the
Q63: Which of the following is a macroeconomic
Q64: Correlation means<br>A) "after this, therefore because of
Q65: The question "Will doctors or lawyers have
Q68: What typically happens to benefits as the
Q69: Scarcity exists because<br>A) human wants exceed the
Q71: Which of the following is a microeconomic
Q72: <img src="https://d2lvgg3v3hfg70.cloudfront.net/TB1458/.jpg" alt=" -A cross-section graph
Q234: Two economists can agree that raising the
Q262: Explain whether the statement, "There is life