Multiple Choice
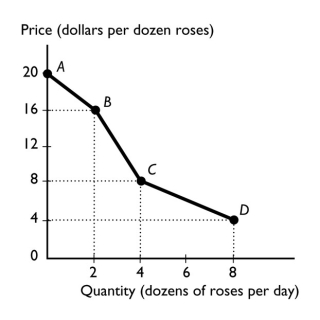
-The figure above shows the relationship between the price of a dozen roses and the quantity of roses a florist can sell.The slope between points A and B is
A) 20.
B) 16.
C) 2.
D) 4
E) nonexistent because at point A, no roses are sold.
Correct Answer:

Verified
Correct Answer:
Verified
Q216: What is the difference between a positive
Q294: We are investigating the relationship among three
Q295: Which of the following BEST describes macroeconomics?<br>A)
Q296: Which type of graph is most useful
Q297: <img src="https://d2lvgg3v3hfg70.cloudfront.net/TB1458/.jpg" alt=" -In the above,in
Q300: Increasing income tax rates will solve the
Q301: John decides to leave college early and
Q302: Which of the following statements is a
Q303: A steep slope in a time series
Q304: Opportunity cost is best defined as<br>A) how