Multiple Choice
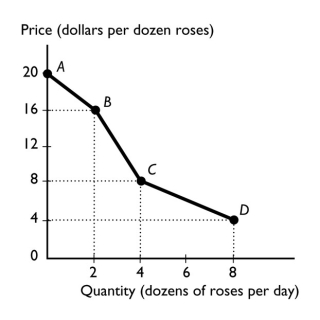
-The figure above shows the relationship between the price of a dozen roses and the quantity of roses a florist can sell.The slope between points C and D equals
A) 8.
B) 4.
C) 2.
D) 1.
E) 12
Correct Answer:

Verified
Correct Answer:
Verified
Related Questions
Q90: What do economists mean when they discuss
Q260: Pumpkins are grown in New Mexico with
Q261: A graph shows the price of a
Q262: The vertical axis in a graph<br>A) is
Q263: If whenever one variable increases,another variable also
Q264: Macroeconomics is the study of<br>A) the actions
Q267: <img src="https://d2lvgg3v3hfg70.cloudfront.net/TB1458/.jpg" alt=" -The table above
Q268: As the number of days without rain
Q269: When people make rational choices,they<br>A) behave selfishly.<br>B)
Q270: When the Dallas Cowboys score more than