Multiple Choice
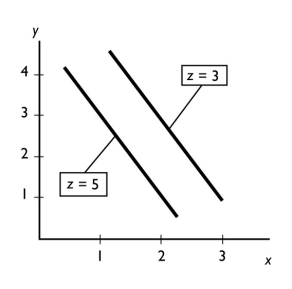
-In the figure above,an increase in z leads to a
A) movement up along one of the lines showing the relationship between x and y.
B) movement down along one of the lines showing the relationship between x and y.
C) rightward shift of the line showing the relationship between x and y.
D) leftward shift of the line showing the relationship between x and y.
E) trend change in both x and y.
Correct Answer:

Verified
Correct Answer:
Verified
Q102: A scatter diagram can be used to
Q103: As the price of home heating oil
Q104: A time series graph<br>A) shows how a
Q105: Which of the following statements is a
Q106: <img src="https://d2lvgg3v3hfg70.cloudfront.net/TB1458/.jpg" alt=" -The graph shows
Q108: <img src="https://d2lvgg3v3hfg70.cloudfront.net/TB1458/.jpg" alt=" -The figure above
Q109: <img src="https://d2lvgg3v3hfg70.cloudfront.net/TB1458/.jpg" alt=" -The figure above
Q110: _ shows the values of a variable
Q111: Which of the following is a positive
Q112: The question "Should we produce LCD televisions