Essay
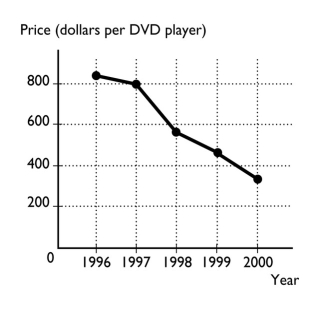
-The figure above shows the price of a DVD player from 1996 to 2000.
a.What type of graph is illustrated above?
b.What is the trend in the price of a DVD player?
Correct Answer:

Verified
a.The graph is a time-series graph becau...View Answer
Unlock this answer now
Get Access to more Verified Answers free of charge
Correct Answer:
Verified
View Answer
Unlock this answer now
Get Access to more Verified Answers free of charge
Q84: List and explain the three fundamental economic
Q85: An opportunity cost is<br>A) the dollar amount
Q87: Scarcity means that<br>A) what we can produce
Q89: Kevin is re-finishing an antique grandfather clock
Q90: The question of "How are goods and
Q91: A time series graph<br>A) shows how a
Q92: <img src="https://d2lvgg3v3hfg70.cloudfront.net/TB1458/.jpg" alt=" -The slope of
Q93: <img src="https://d2lvgg3v3hfg70.cloudfront.net/TB1458/.jpg" alt=" -In the above
Q300: Why do economists say that even very
Q391: <img src="https://d2lvgg3v3hfg70.cloudfront.net/TB8586/.jpg" alt=" -A graph has