Essay
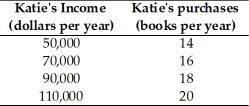
-The table above shows how the number of books Katie buys each year depends on her income
a.What kind of relationship exists between Katie's income and the number of books she purchases?
b.Plot the relationship between Katie's income and the number of books she purchases in the above figure.Measure income along the vertical axis and the number of books along the horizontal axis.Be sure to label the axes.
c.What is the slope of the relationship between $50,000 and $70,000 of income?
d.What is the slope of the relationship between $90,000 and $110,000 of income?
e.Comment on the similarity or dissimilarity of your answers to parts (c)and (d).
Correct Answer:

Verified
a.There is a positive relationship.When ...View Answer
Unlock this answer now
Get Access to more Verified Answers free of charge
Correct Answer:
Verified
View Answer
Unlock this answer now
Get Access to more Verified Answers free of charge
Q169: Microeconomics includes the study of the<br>A) aggregate
Q170: To economists,scarcity means that<br>A) limited wants cannot
Q171: When Gabriel made a rational choice to
Q172: Which type of economic graph reveals trends
Q173: The cost of a one-unit increase in
Q175: The Latin term "ceteris paribus" means<br>A) "false
Q176: <img src="https://d2lvgg3v3hfg70.cloudfront.net/TB1458/.jpg" alt=" -In the above
Q177: A trend is<br>A) a measure of closeness
Q178: Why is the benefit of something measured
Q179: <img src="https://d2lvgg3v3hfg70.cloudfront.net/TB1458/.jpg" alt=" -In the above,which