Essay
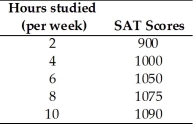
-Jamie is preparing to take his SAT tests.The table above shows how Jamie's score depends on the number of hours a week Jamie studies
a.Plot the relationship in the figure,putting the hours studied on the horizontal axis.
b.Is the relationship you plotted positive or negative?
c.What happens to the slope of the relationship as hours studied increase?
d.Suppose Jamie can enroll in an SAT prep course and,by so doing,for every possible number of hours he studies,his score will be 100 points higher.Plot the new relationship between the number of hours studied and Jamie's SAT score in the figure.
e.How many variables are involved in the figure you just completed?
Correct Answer:

Verified

a.The figure above plots the relations...View Answer
Unlock this answer now
Get Access to more Verified Answers free of charge
Correct Answer:
Verified
a.The figure above plots the relations...
View Answer
Unlock this answer now
Get Access to more Verified Answers free of charge
Q2: Scarcity results from the fact that<br>A) people's
Q3: A graph of the value of one
Q4: Because human wants are insatiable and unlimited
Q5: When a third string NFL quarterback earns
Q6: To show the values of an economic
Q8: A positive statement<br>A) must always be right.<br>B)
Q10: Instead of studying for an additional two
Q11: Whenever people's incomes increase,they buy more guitars.Hence
Q12: A rational choice is one that<br>A) always
Q172: Explain whether the statement, ʺHillary Clinton was