Multiple Choice
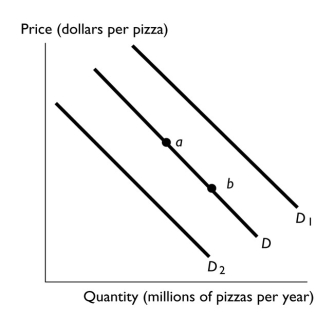
-In the above figure,the movement from point a to point b reflects
A) a decrease in the price of pizza.
B) an increase in the demand for pizza.
C) an increase in the number of people who eat pizza.
D) an increase in the price of the tomato sauce used to produce pizza.
E) a decrease in the number of firms producing pizza.
Correct Answer:

Verified
Correct Answer:
Verified
Q65: What is the difference between quantity supplied
Q125: The American Dairy Association starts a highly
Q128: Suppose the current price of a pound
Q129: If the demand curve for desktop computers
Q131: Advances in productivity increase supply because they
Q132: <img src="https://d2lvgg3v3hfg70.cloudfront.net/TB1458/.jpg" alt=" -The above figure
Q133: <img src="https://d2lvgg3v3hfg70.cloudfront.net/TB1458/.jpg" alt=" -In the above
Q135: Which of the following increases the demand
Q193: List the factors that change supply and
Q449: At prices above the equilibrium price, what