Multiple Choice
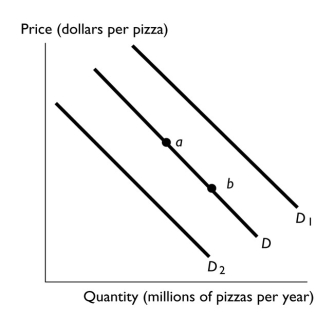
-In the above figure,the shift in the demand curve from D to D? can be the result of
A) an increase in the price of pizza.
B) an increase in the price of a sub sandwich, a substitute for pizza.
C) an increase in the price of soda, a complement to pizza.
D) a change in quantity demanded.
E) a decrease in income if pizza is a normal good.
Correct Answer:

Verified
Correct Answer:
Verified
Q133: What is the difference between a normal
Q155: Oil refiners can refine a barrel of
Q156: Consider the market for leather shoes.If producers
Q157: Smart phones are becoming less expensive as
Q158: The United Auto Workers bargained for higher
Q159: Assume a competitive market is in equilibrium.There
Q161: <img src="https://d2lvgg3v3hfg70.cloudfront.net/TB1458/.jpg" alt=" -The graph illustrates
Q163: <img src="https://d2lvgg3v3hfg70.cloudfront.net/TB1458/.jpg" alt=" -The above figure
Q164: The law of supply states that,other things
Q165: <img src="https://d2lvgg3v3hfg70.cloudfront.net/TB1458/.jpg" alt=" -Using the data