Multiple Choice
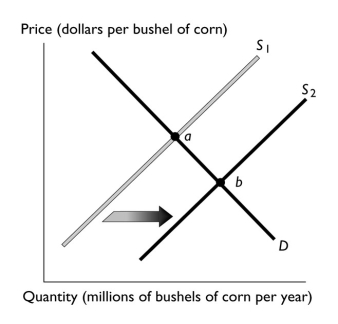
-The above figure illustrates the market for corn.If point "a" represents the original equilibrium and point "b" the new equilibrium,which of the following could have caused the change?
A) a decrease in the number of corn growers
B) a decrease the price of wheat, a substitute in production for corn
C) an increase in the cost of the seed used to grow the corn
D) an decrease in buyers' incomes if corn is an inferior good
E) an increased belief among buyers that corn is healthy
Correct Answer:

Verified
Correct Answer:
Verified
Q92: <img src="https://d2lvgg3v3hfg70.cloudfront.net/TB1458/.jpg" alt=" -A construction boom
Q93: Both the demand for and supply of
Q94: A scooter uses much less gasoline than
Q96: If the demand for used cars decreases
Q98: <img src="https://d2lvgg3v3hfg70.cloudfront.net/TB1458/.jpg" alt=" -The above figure
Q99: Market equilibrium occurs when<br>A) the quantity demanded
Q100: The equilibrium price of a good occurs
Q101: When the demand curve shifts rightward and
Q102: Because of the high cost of fuel,railroads
Q258: <img src="https://d2lvgg3v3hfg70.cloudfront.net/TB8586/.jpg" alt=" -The diagram above