Multiple Choice
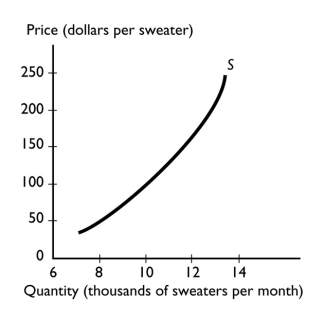
-The graph illustrates the supply of sweaters.A fall in the price of sweaters brings
A) a movement along the supply curve.
B) a decrease in the quantity supplied of sweaters.
C) a shift of the supply curve.
D) Both answers A and B are correct.
E) Both answers B and C are correct.
Correct Answer:

Verified
Correct Answer:
Verified
Q7: If the demand for digital cameras increases
Q8: Which of the following increases the supply
Q9: <img src="https://d2lvgg3v3hfg70.cloudfront.net/TB1458/.jpg" alt=" -Suppose Katie,Mark,and Bobby
Q9: Computers are a complement to computer software.
Q10: List the factors that change demand and
Q11: The number of buyers of sport utility
Q13: If the supply of solar panels increases,<br>A)
Q14: <img src="https://d2lvgg3v3hfg70.cloudfront.net/TB1458/.jpg" alt=" -Scooters and bicycles
Q16: Which of the following is true regarding
Q17: Suppose that the price of flour used