Multiple Choice
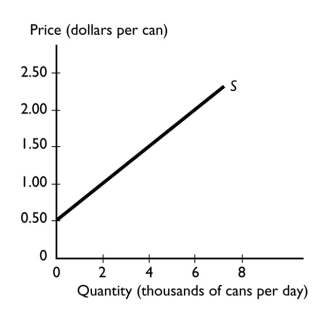
-The graph illustrates the supply of soda.If the price of soda rises from $0.50 a can to $1.50 a can,the quantity of soda supplied
A) increases from 0 cans to 4,000 cans a day.
B) decreases from 4,000 cans to 0 cans a day.
C) remains unchanged because the supply increases not the quantity supplied.
D) increases from 0 to 6,000 cans a day.
E) remains unchanged because the supply decreases not the quantity supplied.
Correct Answer:

Verified
Correct Answer:
Verified
Q140: The quantity supplied of a good,service,or resource
Q141: <img src="https://d2lvgg3v3hfg70.cloudfront.net/TB1458/.jpg" alt=" -Which figure above
Q143: <img src="https://d2lvgg3v3hfg70.cloudfront.net/TB1458/.jpg" alt=" -In the above
Q144: <img src="https://d2lvgg3v3hfg70.cloudfront.net/TB1458/.jpg" alt=" -In the figure
Q146: <img src="https://d2lvgg3v3hfg70.cloudfront.net/TB1458/.jpg" alt=" -The table above
Q147: Suppose Ramen noodles,an inexpensive but a quite
Q148: If the price of carrots is below
Q149: Other things remaining the same,the quantity of
Q150: Which of the following lowers the equilibrium
Q486: <img src="https://d2lvgg3v3hfg70.cloudfront.net/TB8586/.jpg" alt=" -The above table