Multiple Choice
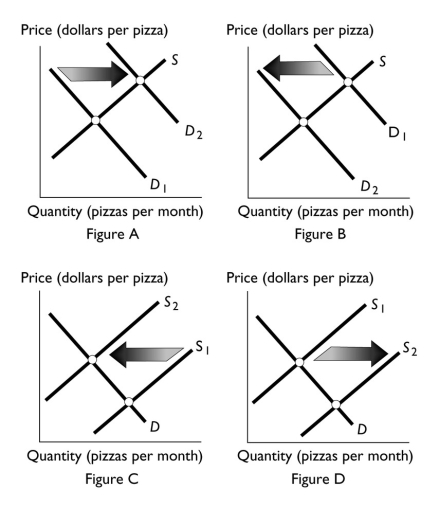
-Which figure above shows the effect of an increase in the cost of the tomato sauce used to produce pizza?
A) Figure A
B) Figure B
C) Figure C
D) Figure D
E) Both Figure B and Figure C
Correct Answer:

Verified
Correct Answer:
Verified
Q195: Consumers can use either natural gas or
Q263: What is the law of demand?
Q263: <img src="https://d2lvgg3v3hfg70.cloudfront.net/TB1458/.jpg" alt=" -The figure above
Q264: Which of the following describes the law
Q265: <img src="https://d2lvgg3v3hfg70.cloudfront.net/TB1458/.jpg" alt=" -The above figure
Q268: <img src="https://d2lvgg3v3hfg70.cloudfront.net/TB1458/.jpg" alt=" -In an effort
Q269: Which of the following is true?<br>A) For
Q270: The quantity supplied of a good is<br>A)
Q271: Market demand curves are obtained by<br>A) determining
Q272: A demand schedule<br>A) shows the quantity demanded