Multiple Choice
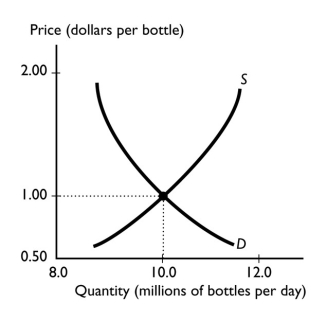
-The graph illustrates the market for bottled water.When the price exceeds the equilibrium price,the quantity demanded is ________ the quantity supplied and the price of the good will ________.
A) less then; fall
B) greater than; rise
C) greater than; fall
D) less than; rise
E) equal to; fall
Correct Answer:

Verified
Correct Answer:
Verified
Q6: When the price of rice rises,<br>A) the
Q81: <img src="https://d2lvgg3v3hfg70.cloudfront.net/TB1458/.jpg" alt=" -The above figures
Q82: If macaroni and cheese is an inferior
Q84: Consumers eat salsa with taco chips.The price
Q87: When there is a shortage of parking
Q88: Which of the following does NOT increase
Q90: A popular dinner among college students today
Q91: The market demand curve for mousetraps is<br>A)
Q230: What leads to a decrease in the
Q239: What are substitutes in production?