Multiple Choice
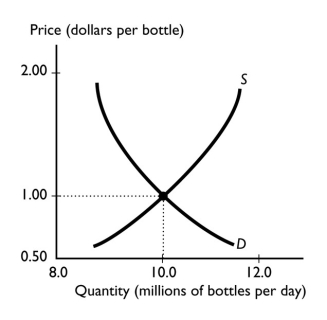
-The graph illustrates the market for bottled water.If the producers of bottled water switch to using improved technology,then the
A) supply of bottled water decreases.
B) quantity demanded of bottled water increases.
C) quantity demanded of bottled water does not change.
D) price of bottled water rises.
E) supply curve shifts leftward.
Correct Answer:

Verified
Correct Answer:
Verified
Q314: If income increases and the demand for
Q315: <img src="https://d2lvgg3v3hfg70.cloudfront.net/TB1458/.jpg" alt=" -The above figures
Q316: A huge 50 percent off sale on
Q317: The technology associated with manufacturing computers has
Q318: Suppose the equilibrium price of movie tickets
Q320: Candy makers accurately anticipate the increase in
Q321: If the automobile workers' union successfully negotiates
Q322: Millions of people from Mexico have migrated
Q323: Suppose that the price of bread rises.This
Q324: Why does an increase in supply lead