Multiple Choice
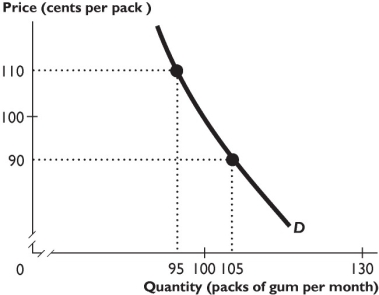
-The demand curve shown in the figure above is ________ over the price range from $0.90 to $1.10 per pack.
A) perfectly elastic
B) perfectly inelastic
C) unit elastic
D) elastic but not perfectly elastic
E) inelastic but not perfectly inelastic
Correct Answer:

Verified
Correct Answer:
Verified
Q195: If the percentage change in price is
Q196: Assume that it is predicted that for
Q197: When the price of a burrito increases
Q198: If demand is price inelastic and the
Q199: Alan purchases 10 percent fewer bags of
Q201: In the mid-1970s,Newsweek magazine reported that the
Q202: In the figure above,when the price falls
Q204: The price of one bedroom apartments in
Q205: Supply is unit elastic when the<br>A) supply
Q484: <img src="https://d2lvgg3v3hfg70.cloudfront.net/TB8586/.jpg" alt=" -The table above