Multiple Choice
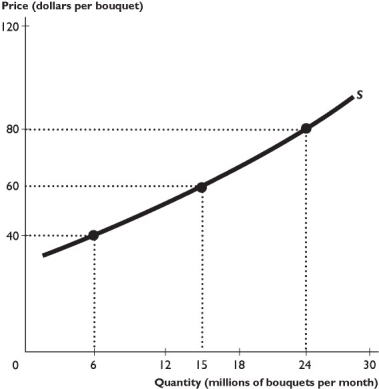
The figure above shows the supply curve for roses.
-In the figure above,at the point where the price is $50 per bunch,the price elasticity of supply is
A) 2.14.
B) 0.47.
C) 1.
D) 3.
E) 0.33.
Correct Answer:

Verified
Correct Answer:
Verified
Related Questions
Q20: <img src="https://d2lvgg3v3hfg70.cloudfront.net/TB1458/.jpg" alt=" -The figure above
Q28: If a good has many close substitutes,then
Q30: When income increases from $20,000 to $30,000
Q31: "If the price falls and,as a result,the
Q32: If we ignore the negative or positive
Q34: Many manufactured goods have an _ supply
Q35: If demand is _,a price cut _
Q36: The elasticity of demand is used to<br>A)
Q38: When the percentage change in the quantity
Q441: The demand for oil is inelastic. So,