Multiple Choice

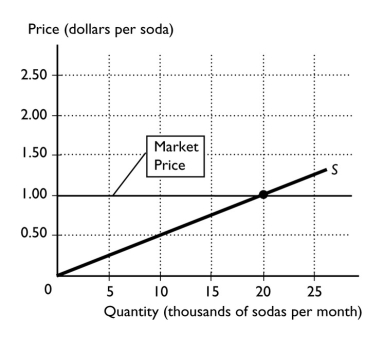
-The figure above shows the supply curve for soda.The market price is $1.00 per soda.The producer surplus from the 10,000th soda is
A) $0.00.
B) $0.50.
C) $1.00.
D) more than $1.00.
E) None of the above answers is correct.
Correct Answer:

Verified
Correct Answer:
Verified
Q131: Which of the following is true?<br>i.Production efficiency
Q132: Adam Smith's Wealth of Nations,written in 1776,describes
Q133: In the figure above,when 2,000 pizzas are
Q135: Why does redistribution,so that the distribution of
Q138: If marginal benefit is equal to marginal
Q139: Which of the following is a correct
Q140: If a seller charges a buyer the
Q141: The price of a cowboy hat is
Q150: Explain how the invisible hand delivers an
Q426: <img src="https://d2lvgg3v3hfg70.cloudfront.net/TB8586/.jpg" alt=" -Using the values