Multiple Choice
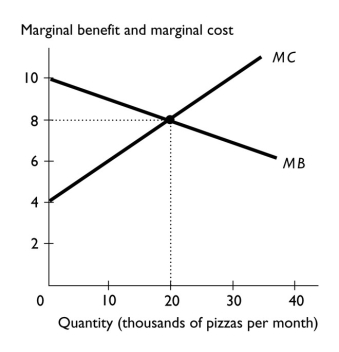
-The figure above shows the marginal benefit and marginal cost curves for pizza.In the figure,what is the efficient quantity of pizza?
A) 0 pizzas
B) 10,000 pizzas
C) 20,000 pizzas
D) 30,000 pizzas
E) The efficient quantity cannot be determine without more information.
Correct Answer:

Verified
Correct Answer:
Verified
Q49: Jason needs help getting ready for the
Q213: Jake just bought a new hockey stick.When
Q214: Draw and describe a marginal cost curve
Q216: To achieve allocative efficiency,an economy<br>A) must produce
Q217: Marginal benefit is the benefit that a
Q218: What must be true for a producer
Q219: Samantha was willing to pay $10 for
Q220: Marginal benefit curves<br>A) have positive slopes.<br>B) have
Q371: Jason hires Maria to tutor him in
Q439: What approach to fairness argues in favor