Multiple Choice
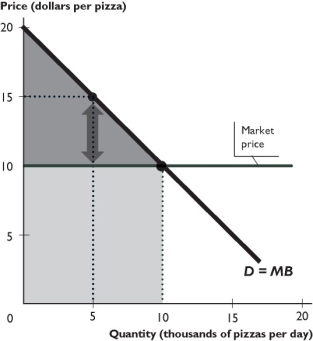
The figure above shows the demand curve for pizza and the market price of pizza.
-In the figure above,what is the consumer surplus per day?
A) $100,000
B) $50,000
C) $125,000
D) $150,000
E) zero
Correct Answer:

Verified
Correct Answer:
Verified
Q29: <img src="https://d2lvgg3v3hfg70.cloudfront.net/TB8586/.jpg" alt=" -The figure above
Q352: Draw and describe a marginal benefit curve
Q353: Allocative efficiency occurs when<br>A) the most highly
Q354: Briefly describe the concept of the "invisible
Q355: <img src="https://d2lvgg3v3hfg70.cloudfront.net/TB1458/.jpg" alt=" -In the figure
Q356: Is the marginal benefit someone enjoys from
Q358: <img src="https://d2lvgg3v3hfg70.cloudfront.net/TB1458/.jpg" alt=" -In the above
Q359: <img src="https://d2lvgg3v3hfg70.cloudfront.net/TB1458/.jpg" alt=" -The figure above
Q360: Although Jack and Vanessa were equally qualified,Jack
Q361: Which of the following can result in