Multiple Choice

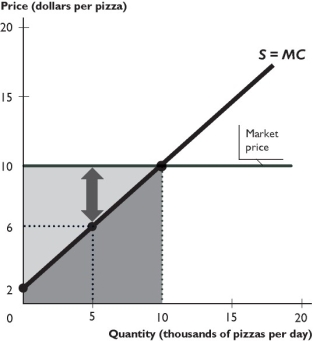
The figure above shows the supply curve for pizza and the market price of pizza.
-In the figure above,the total revenue from pizza per day is
A) $60,000.
B) $100,000.
C) $40,000.
D) $80,000.
E) $50,000.
Correct Answer:

Verified
Correct Answer:
Verified
Q147: Wal-Mart has a limited number of "Black
Q148: <img src="https://d2lvgg3v3hfg70.cloudfront.net/TB1458/.jpg" alt=" -The figure above
Q149: Marginal benefit is the<br>A) total benefit we
Q150: The efficiency of competitive markets happens because<br>A)
Q151: Which of the following statements is correct?<br>i.The
Q153: Which of the following is most closely
Q154: The difference between the marginal benefit from
Q155: <img src="https://d2lvgg3v3hfg70.cloudfront.net/TB1458/.jpg" alt=" -In the figure
Q156: Outcomes are fair according to the<br>A) rules
Q157: Suppose the nation is producing at a