Multiple Choice
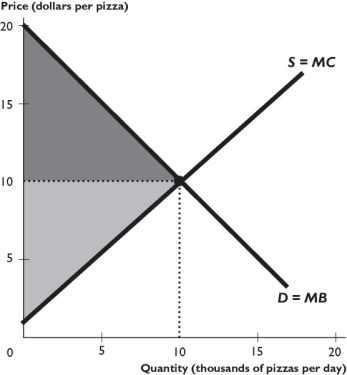
The figure above shows the market for pizza.
-In the figure above,when the market is in equilibrium,marginal benefit ________ marginal cost,so the quantity of pizza produced is ________.
A) equals; efficient
B) exceeds; efficient
C) is below; efficient
D) is below; not efficient
E) exceeds; not efficient
Correct Answer:

Verified
Correct Answer:
Verified
Q344: Which of the following is true regarding
Q345: Which of the following is an example
Q346: The producer surplus is found by subtracting
Q347: Mandy saved her allowance to buy a
Q348: <img src="https://d2lvgg3v3hfg70.cloudfront.net/TB1458/.jpg" alt=" -Bill and Krista
Q350: When the market price rises,the consumers' consumer
Q351: Suppose a market produces 5,000 tons of
Q352: Draw and describe a marginal benefit curve
Q353: Allocative efficiency occurs when<br>A) the most highly
Q354: Briefly describe the concept of the "invisible