Multiple Choice
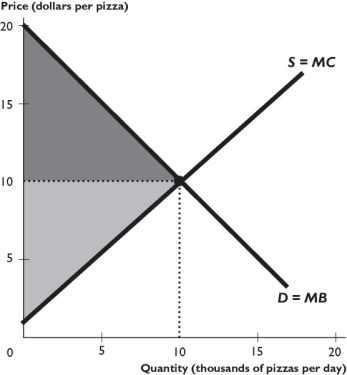
The figure above shows the market for pizza.
-In the figure above,if pizza production increases to 15,000 pizzas a day,the deadweight loss is
A) $45,000 per day.
B) $12,500 per day.
C) $22,500 per day.
D) $90,000 per day.
E) zero.
Correct Answer:

Verified
Correct Answer:
Verified
Q42: What is the "invisible hand"?
Q57: How can a person argue that health
Q260: To achieve allocative efficiency,one must compare the<br>A)
Q261: Marginal benefit equals the<br>A) benefit that a
Q262: The demand curve is the same as
Q263: Canned milk was only rationed to babies
Q266: <img src="https://d2lvgg3v3hfg70.cloudfront.net/TB1458/.jpg" alt=" -The figure above
Q267: Which of the following is part of
Q268: <img src="https://d2lvgg3v3hfg70.cloudfront.net/TB1458/.jpg" alt=" The figure
Q269: When the marginal cost of producing a