Multiple Choice
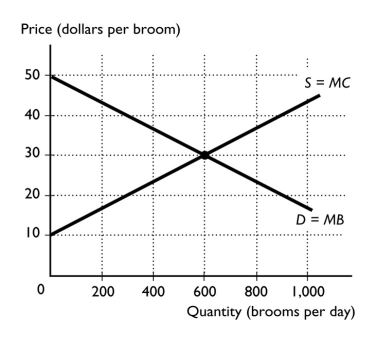
-The figure above shows the market for brooms.Which of the following could lead to the production of fewer than 600 brooms?
A) a monopoly
B) a deadweight loss
C) subsidies
D) an external cost
E) a big tradeoff
Correct Answer:

Verified
Correct Answer:
Verified
Q68: Why does the problem of the big
Q186: <img src="https://d2lvgg3v3hfg70.cloudfront.net/TB1458/.jpg" alt=" -The figure above
Q187: The "fair rules" view of fairness is
Q188: Consumers' total benefit from consuming a good
Q189: Why is the demand curve the same
Q190: <img src="https://d2lvgg3v3hfg70.cloudfront.net/TB1458/.jpg" alt=" -In the above
Q192: The "equality of opportunity" idea of fairness
Q193: <img src="https://d2lvgg3v3hfg70.cloudfront.net/TB1458/.jpg" alt=" -In the figure
Q194: <img src="https://d2lvgg3v3hfg70.cloudfront.net/TB1458/.jpg" alt=" -The figure above
Q196: Which of the following leads to a