Essay
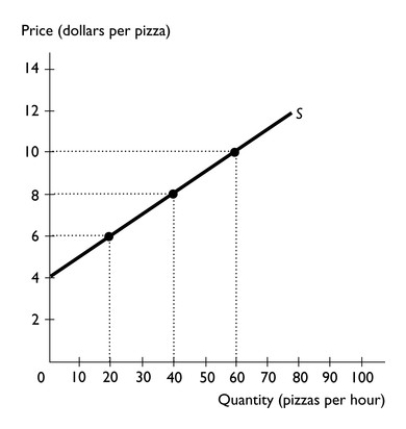
-The figure above shows the supply curve for pizzas.
a.What is the marginal cost of the 20th pizza?
b.What is the minimum supply price of the 20th pizza?
c.If the price is $6 per pizza,what is the producer surplus on the 20th pizza?
d.If the price is $6 per pizza,what is the producer surplus for the total quantity of pizzas produced?
e.If the price is $8 per pizza,what is the producer surplus for the total quantity of pizzas produced?
f.If the price is $10 per pizza,what is the producer surplus for the total quantity of pizzas produced?
Correct Answer:

Verified
a.The marginal cost of the 20th pizza is...View Answer
Unlock this answer now
Get Access to more Verified Answers free of charge
Correct Answer:
Verified
View Answer
Unlock this answer now
Get Access to more Verified Answers free of charge
Q68: Why does the problem of the big
Q194: <img src="https://d2lvgg3v3hfg70.cloudfront.net/TB1458/.jpg" alt=" -The figure above
Q196: Which of the following leads to a
Q197: <img src="https://d2lvgg3v3hfg70.cloudfront.net/TB1458/.jpg" alt=" The figure
Q198: Jenn is willing to pay $75 for
Q200: When society produces the combination of goods
Q201: Obstacles in achieving efficiency in a market
Q202: The supply curve is the same as
Q204: A marginal benefit curve<br>A) is the same
Q243: Compare and contrast production efficiency and allocative