Short Answer
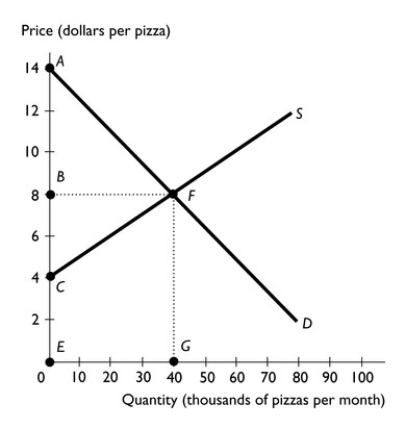
-The figure above shows the supply and demand curves for pizza.If the market is at its competitive equilibrium,what area in the graph above represents:
a.consumer surplus?
b.producer surplus?
Correct Answer:

Verified
Correct Answer:
Verified
Q297: <img src="https://d2lvgg3v3hfg70.cloudfront.net/TB1458/.jpg" alt=" -In the above
Q298: The marginal benefit from buying a particular
Q299: <img src="https://d2lvgg3v3hfg70.cloudfront.net/TB1458/.jpg" alt=" -The figure above
Q300: <img src="https://d2lvgg3v3hfg70.cloudfront.net/TB1458/.jpg" alt=" -The figure above
Q301: A supply curve is the same as
Q303: At the current production point on a
Q304: Air pollution is an external cost because
Q305: <img src="https://d2lvgg3v3hfg70.cloudfront.net/TB1458/.jpg" alt=" -In the figure
Q306: When less than the efficient amount of
Q307: Marginal benefit<br>A) increases as more of a