Multiple Choice
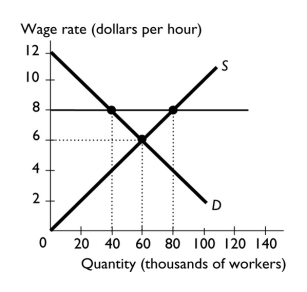
-The figure above shows the labor market in a region.If a minimum wage of $8 an hour is imposed,then the quantity of labor supplied is ________ and the quantity of labor demanded is ________.
A) 60,000; 60,000
B) 80,000; 40,000
C) 40,000; 60,000
D) 60,000; 40,000
E) 40,000; 40,000
Correct Answer:

Verified
Correct Answer:
Verified
Q6: Why would an increase in the minimum
Q46: <img src="https://d2lvgg3v3hfg70.cloudfront.net/TB1458/.jpg" alt=" -The labor demand
Q47: <img src="https://d2lvgg3v3hfg70.cloudfront.net/TB1458/.jpg" alt=" -The above figure
Q48: <img src="https://d2lvgg3v3hfg70.cloudfront.net/TB1458/.jpg" alt=" -The above figure
Q49: <img src="https://d2lvgg3v3hfg70.cloudfront.net/TB1458/.jpg" alt=" -The above figure
Q50: <img src="https://d2lvgg3v3hfg70.cloudfront.net/TB1458/.jpg" alt=" -The graph shows
Q52: Which of the following is an example
Q54: What is a price support program in
Q55: <img src="https://d2lvgg3v3hfg70.cloudfront.net/TB1458/.jpg" alt=" -The above figure
Q56: <img src="https://d2lvgg3v3hfg70.cloudfront.net/TB1458/.jpg" alt=" The figure