Multiple Choice
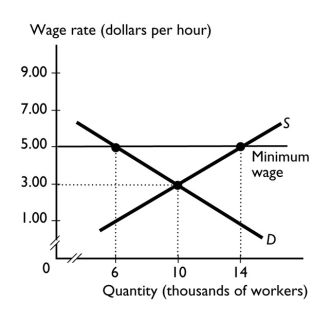
-The graph shows the labor market for apple pickers in Ohio.If the government sets a minimum wage of $5 an hour,________ apple pickers are unemployed.
A) 6,000
B) 8,000
C) 10,000
D) 14,000
E) more than 14,000
Correct Answer:

Verified
Correct Answer:
Verified
Q198: Suppose the current equilibrium wage rate for
Q199: <img src="https://d2lvgg3v3hfg70.cloudfront.net/TB1458/.jpg" alt=" -The above figure
Q200: A price floor<br>A) is the highest price
Q201: A rent ceiling set below the equilibrium
Q202: Suppose that the government imposes a price
Q204: We know that the minimum wage causes
Q205: If a rent ceiling is below the
Q206: <img src="https://d2lvgg3v3hfg70.cloudfront.net/TB1458/.jpg" alt=" -In the figure
Q207: In a housing market with a rent
Q208: A minimum wage increases unemployment by<br>A) increasing