Multiple Choice
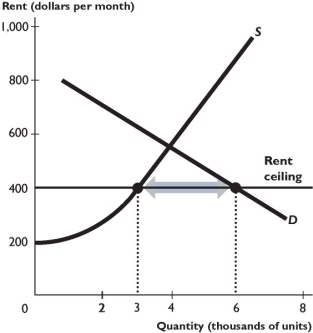
The figure above shows the supply and demand curves in the market for rental housing. A rent ceiling is set at $400 per month.
-In the figure above,with the rent ceiling
A) there is a shortage of 3,000 units.
B) there is a surplus of 3,000 units.
C) there is a surplus of 2,000 units.
D) there is a shortage of 1,000 units.
E) the market is in equilibrium.
Correct Answer:

Verified
Correct Answer:
Verified
Q4: <img src="https://d2lvgg3v3hfg70.cloudfront.net/TB1458/.jpg" alt=" -The above figure
Q5: <img src="https://d2lvgg3v3hfg70.cloudfront.net/TB1458/.jpg" alt=" -The above figure
Q6: Suppose the city of Chicago imposes a
Q7: The methods that governments use to support
Q8: A black market for housing exists because
Q10: <img src="https://d2lvgg3v3hfg70.cloudfront.net/TB1458/.jpg" alt=" -The demand and
Q11: <img src="https://d2lvgg3v3hfg70.cloudfront.net/TB1458/.jpg" alt=" -The above figure
Q12: Assuming that the rent ceiling is strictly
Q13: In a housing market with a rent
Q14: <img src="https://d2lvgg3v3hfg70.cloudfront.net/TB1458/.jpg" alt=" -The above figure