Multiple Choice
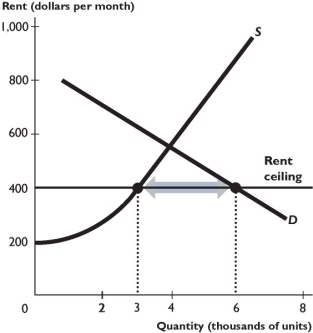
The figure above shows the supply and demand curves in the market for rental housing. A rent ceiling is set at $400 per month.
-In the figure above,with the rent ceiling ________ units of housing are available,and black market rents might be as high as ________ a month.
A) 3,000; $625
B) 6,000; $400
C) 3,000; $550
D) 4,000; $550
E) 4,000; $625
Correct Answer:

Verified
Correct Answer:
Verified
Q6: Why would an increase in the minimum
Q52: Which of the following is an example
Q54: What is a price support program in
Q55: <img src="https://d2lvgg3v3hfg70.cloudfront.net/TB1458/.jpg" alt=" -The above figure
Q56: <img src="https://d2lvgg3v3hfg70.cloudfront.net/TB1458/.jpg" alt=" The figure
Q58: In the market for cotton,suppose the equilibrium
Q59: Who gains from a price support? Who
Q60: Black markets can occur when price ceilings
Q61: Assume a market is producing efficiently.Which type
Q62: A regulation that sets the highest price