Multiple Choice
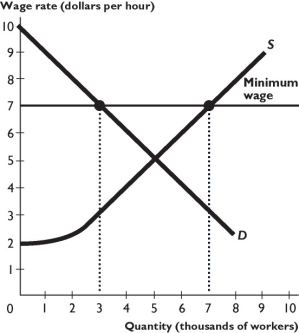
The figure above shows supply and demand in the market for labor. The government introduces a minimum wage of $7 per hour.
-The figure above shows that the lowest wage rate for which someone is willing to work is
A) $3 an hour.
B) $5 an hour.
C) $6 an hour.
D) $7 an hour.
E) $4 an hour.
Correct Answer:

Verified
Correct Answer:
Verified
Q162: <img src="https://d2lvgg3v3hfg70.cloudfront.net/TB1458/.jpg" alt=" The figure
Q163: <img src="https://d2lvgg3v3hfg70.cloudfront.net/TB1458/.jpg" alt=" -The above figure
Q164: When a price support is set below
Q165: A price ceiling is<br>A) a maximum legal
Q166: <img src="https://d2lvgg3v3hfg70.cloudfront.net/TB1458/.jpg" alt=" -The graph shows
Q168: <img src="https://d2lvgg3v3hfg70.cloudfront.net/TB1458/.jpg" alt=" -The figure above
Q169: <img src="https://d2lvgg3v3hfg70.cloudfront.net/TB1458/.jpg" alt=" -The graph shows
Q170: <img src="https://d2lvgg3v3hfg70.cloudfront.net/TB1458/.jpg" alt=" -The above figure
Q171: The minimum wage is set above the
Q172: An illegal market in which the price