Multiple Choice
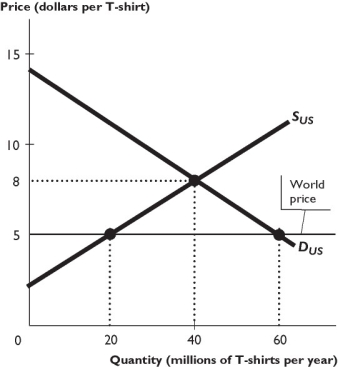
The figure above shows the U.S. market for T-shirts, where SUS is the domestic supply curve and DUS is the domestic demand curve. The United States trades freely with the rest of the world. The world price of a T-shirt is $5.
-In the figure above,with international trade the United States ________ million T-shirts per year.
A) imports 40
B) exports 40
C) exports 20
D) imports 20
E) imports 60
Correct Answer:

Verified
Correct Answer:
Verified
Q59: What is "rent seeking?" How does it
Q198: A flawed argument for protection from foreign
Q199: If the opportunity cost of producing a
Q200: When a nation imports a good or
Q201: <img src="https://d2lvgg3v3hfg70.cloudfront.net/TB1458/.jpg" alt=" -The above figure
Q202: <img src="https://d2lvgg3v3hfg70.cloudfront.net/TB1458/.jpg" alt=" -The above figure
Q204: Looking at the average tariff rate in
Q205: When a nation exports a good or
Q207: Imposing a tariff on a good leads
Q208: The United States<br>A) needs tariffs to allow