Multiple Choice
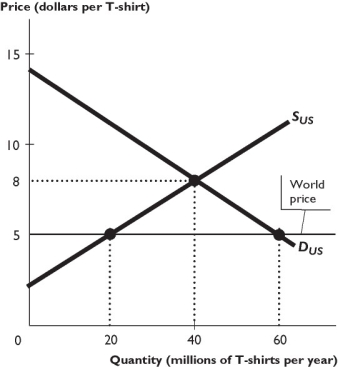
The figure above shows the U.S. market for T-shirts, where SUS is the domestic supply curve and DUS is the domestic demand curve. The United States trades freely with the rest of the world. The world price of a T-shirt is $5.
-Based on the figure above,international trade leads to
A) a net gain of surplus of $60 million.
B) a net loss of surplus of $60 million.
C) a net gain of surplus of $90 million.
D) a net loss of surplus of $90 million.
E) no net gain or loss of surplus.
Correct Answer:

Verified
Correct Answer:
Verified
Q61: How does a quota affect the consumer
Q62: <img src="https://d2lvgg3v3hfg70.cloudfront.net/TB1458/.jpg" alt=" The figure
Q63: Suppose that elimination of tariffs on agricultural
Q64: A country exports the goods<br>A) for which
Q65: <img src="https://d2lvgg3v3hfg70.cloudfront.net/TB1458/.jpg" alt=" The figure
Q67: If the U.S.government imposes a tariff on
Q68: International trade decreases the demand for workers
Q69: When a country exports a good,the country's
Q70: <img src="https://d2lvgg3v3hfg70.cloudfront.net/TB1458/.jpg" alt=" -The above figure
Q71: Economists argue for free trade in export