Multiple Choice
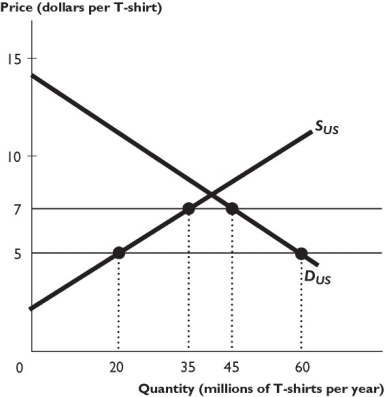
The figure above shows the U.S. market for T-shirts, where SUS is the domestic supply curve and DUS is the domestic demand curve. The world price of a T-shirt is $5. The U.S. government imposes a $2 per unit tariff on imported T-shirts.
-The figure above shows that as a result of the tariff,the price of a T-shirt in the United States ________,and the quantity of T-shirts bought ________.
A) rises by $2; decreases by 15 million per year
B) rises by $2; increases by 15 million per year
C) falls by $2; increases by 5 million per year
D) does not change; decreases by 5 million per year
E) does not change; does not change
Correct Answer:

Verified
Correct Answer:
Verified
Q183: What is rent seeking with respect to
Q184: When a nation starts importing a good
Q185: U.S.tariffs on Canadian lumber have led to
Q186: Which of the following is NOT a
Q187: <img src="https://d2lvgg3v3hfg70.cloudfront.net/TB1458/.jpg" alt=" The figure
Q189: Of the following,who gains with a tariff?<br>A)
Q190: What is the national security argument for
Q191: When Italy buys Boeing jets,the price Italy
Q192: Which of the following is the national
Q193: When a nation exports a good or