Multiple Choice
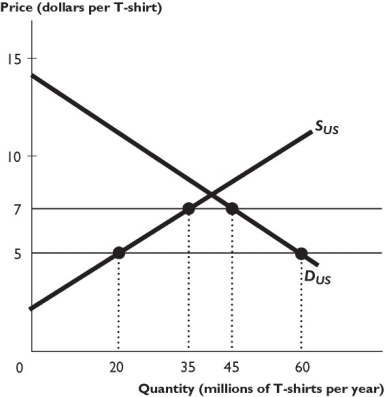
The figure above shows the U.S. market for T-shirts, where SUS is the domestic supply curve and DUS is the domestic demand curve. The world price of a T-shirt is $5. The U.S. government imposes a $2 per unit tariff on imported T-shirts.
-The figure above shows that the government revenue from the tariff is
A) $20 million per year.
B) $30 million per year.
C) $15 million per year.
D) $55 million per year.
E) zero.
Correct Answer:

Verified
Correct Answer:
Verified
Q113: Since the mid-1970s,the average U.S.tariff rate is<br>A)
Q114: <img src="https://d2lvgg3v3hfg70.cloudfront.net/TB1458/.jpg" alt=" -The above figure
Q115: Which of the following methods of restricting
Q116: In the 1950s,crude oil and natural gas
Q117: As a result of U.S.tariffs on fishnets
Q119: If the United States imposes a tariff
Q120: What is an effective counter against the
Q121: Of the following,who is harmed by a
Q122: <img src="https://d2lvgg3v3hfg70.cloudfront.net/TB1458/.jpg" alt=" -The above figure
Q123: Imports _ consumer surplus,_ producer surplus,and _