Multiple Choice
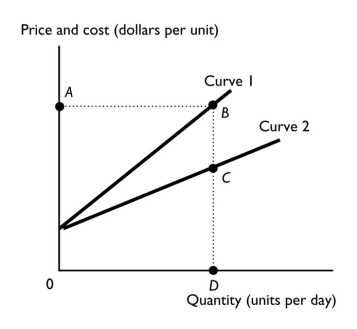
-The figure above represents the relationship between output and cost in an industry with an external cost.Which line represents the marginal private cost (MC) curve?
A) Curve 1
B) Curve 2
C) the dotted line BC
D) the y-axis
E) the dotted line AB
Correct Answer:

Verified
Correct Answer:
Verified
Q9: <img src="https://d2lvgg3v3hfg70.cloudfront.net/TB1458/.jpg" alt=" -The figure above
Q10: Suppose unregulated production of pesticides results in
Q11: Which of the following is the best
Q12: The basic reason that a competitive unregulated
Q13: <img src="https://d2lvgg3v3hfg70.cloudfront.net/TB1458/.jpg" alt=" -The figure above
Q15: Joanne rents a TV production studio to
Q16: Evidence of external costs in the production
Q17: A subsidy is<br>A) the revenue received from
Q19: Which of the following is an example
Q61: What do we mean by "property rights"