Multiple Choice
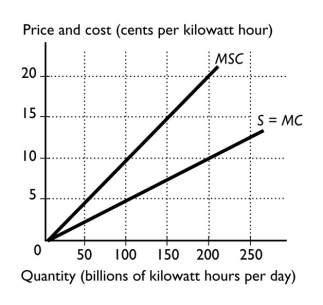
-The figure above shows the marginal social cost curve of generating electricity and the marginal private cost curve.The marginal cost borne by producers when 100 billion kilowatt hours are produced is
A) 5¢ per kilowatt.
B) 10¢ per kilowatt.
C) 15¢ per kilowatt.
D) 20¢ per kilowatt.
E) 0¢ per kilowatt.
Correct Answer:

Verified
Correct Answer:
Verified
Q162: What is the Coase theorem? What conditions
Q284: The Coase theorem is the proposition that
Q285: If a product has an external benefit,how
Q286: Which of the following is a method
Q287: <img src="https://d2lvgg3v3hfg70.cloudfront.net/TB1458/.jpg" alt=" The figure
Q289: To ensure all students are protected from
Q290: Marginal private cost<br>A) is always zero if
Q291: To eliminate the inefficiency resulting from pollution
Q292: For a government subsidy on a good
Q293: If a product has zero external costs,then<br>A)