Multiple Choice
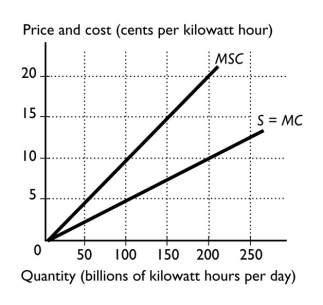
-The figure above shows the marginal social cost curve of generating electricity and the marginal private cost curve.The marginal external cost when 100 billion kilowatt hours are produced is
A) 0¢ per kilowatt.
B) 5¢ per kilowatt.
C) 10¢ per kilowatt.
D) 15¢ per kilowatt.
E) 20¢ per kilowatt.
Correct Answer:

Verified
Correct Answer:
Verified
Q242: Vouchers given to consumers<br>A) increase the demand
Q243: Which of the following is a common
Q244: In the figure above,when the market is
Q245: Marginal social cost is the<br>A) price a
Q246: A problem with pollution charges or taxes
Q248: The Coase theorem deals with the problem
Q249: Suppose scientific research generates external benefits.Without government
Q250: <img src="https://d2lvgg3v3hfg70.cloudfront.net/TB1458/.jpg" alt=" -The figure above
Q251: Education has an external benefit.So to achieve
Q252: If a good has an external cost,then